Use Excel to create a Balance Sheet view
The basic accounting equation, also called the balance sheet equation, represents the relationship between the assets, liabilities, and owner’s equity of a business. It is the foundation for the double-entry bookkeeping system. For each transaction, the total debits equal the total credits. It can be expressed as


In a corporation, capital represents the stockholders’ equity. Since every business transaction affects at least two of a company’s accounts, the accounting equation will always be “in balance,” meaning the left side should always equal the right side. Thus, the accounting formula essentially shows that what the firm owns (its assets) is purchased by either what it owes (its liabilities) or by what its owners invest (its shareholders equity or capital).
(from Wikipedia)
And because we are plotting a corporate balance sheet, we state the formula:
Assets = Liabilities + Equity
, which in turn could be expressed as
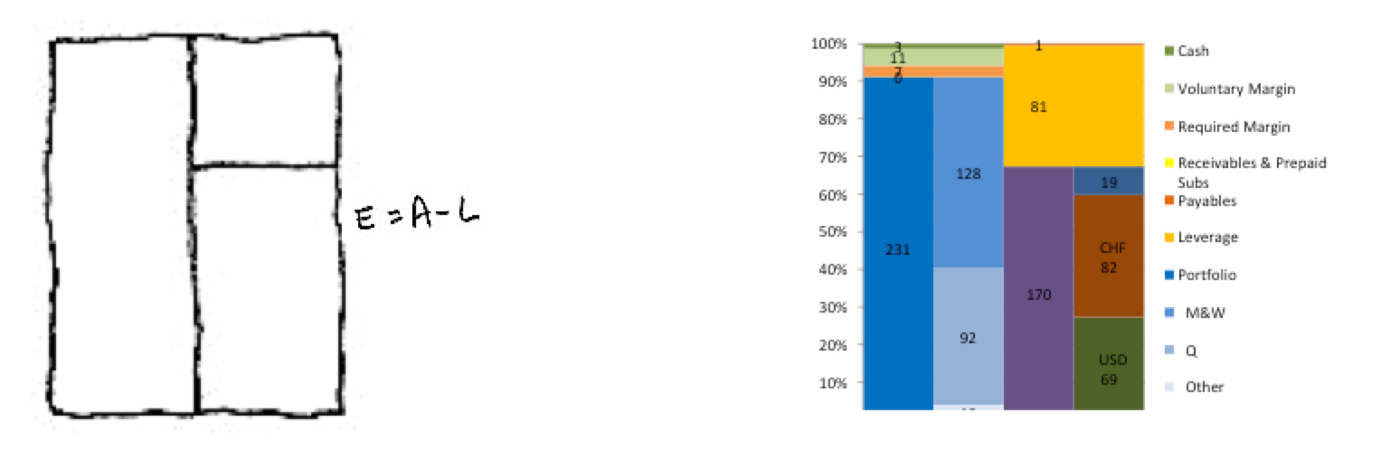
E=A-L
This basic and simple view of the balance sheet (BS) allows managers to grasp the full picture very quickly.
As a way of example, we have translated into Excel the BS of an imaginary legal entity that holds a portfolio of funds. This entity is being financed by investors in the equity tranche in 3 different currencies: US dollars, Swiss Francs and Euros. It also uses a credit line to boost its performance. On the assets side, besides the portfolio, there is unencumbered cash, cash reserved solely to cure any margin call, and a margin deposited in a bank as a collateral of the FX hedging needed.
In a blink, we can asses how far away the entity is from being distressed. We can also elaborate a visual understanding of how much the portfolio is actually levered. And we can asses what parts of the equity tranche (net asset value or NAV) are being funded in each currency.
The invested portfolio is the blue area that is further subdivided into lighter blues indicating funds grouped by different liquidity. Assets are presented sorted by liquidity, therefore the first lighter blue area indicates funds with weekly and monthly liquidity, the second with quarterly and the rest are less liquid funds.
We have done all this using a set of Store Procedures and qUtopic functions connected to a Webfolio’s database running on SQL Server .