Statistical Sheets
Built-in pre-formatted ready-to-use templates. The Statistical Sheets (SS) are a set of the 3 reports that can be produced on the fly in less than 10 seconds (and depending how fast is you access to your database).
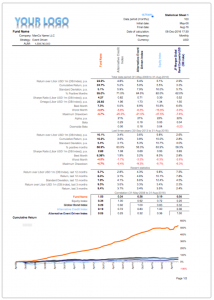
 SS1: This is an executive summary of a fund’s track record. It shows the performance of the selected fund along with 4 optional benchmarks. Key metrics are grouped in 3 different time windows: Total period, last 3 years and recent statistics where the last 12 months are shown.
This is followed by a small correlation matrix follows with a VAMI chart. VAMI stands for value added monthly indicator, that is the cumulative value an investor gets when invests in the fund.
In the second page includes a performance table, showing monthly performance numbers and YTD totals, together with a set of four charts: Rolling monthly correlation against the benchmarks, autocorrelation for different time windows to see seasonality and Level 3 assets, standard deviation and underwater curve.
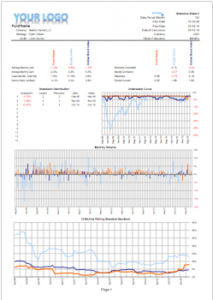
SS2: This report is an extension of the the SS1. It shows differs views of the performance track record of the fund against 2 selected benchmarks. the first page shows a more deepen view of the underwater curve, monthly returns over time, and a 12 months rolling standard deviation chart.
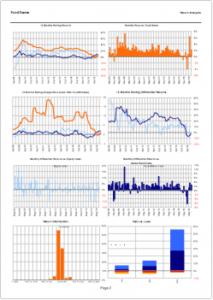
The second page shows 12 months rolling returns, monthly returns bars, 12 months rolling Sharpe ratio, 12 months rolling differential returns (against the benchmarks), monthly differential returns against each of the benchmarks, a frequency distribution chart and a gain vs
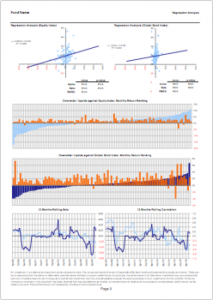
The last page shows a scatter plot with a regression line for the fund against each of the selected benchmarks in which is easy to visualise the correlation between time series. A fitting equation, together with a squared-R results are also included.
Below includes charts depicting 12 months rolling betas and correlations to the selected benchmarks.